Asia Zero Emission Center
Decarbonisation
Pathway in ASEAN
To help Asian countries shape their vision, roadmap, and policies toward decarbonisation, the Asia Zero Emission Center, in collaboration with the Institute for Energy Economics, Japan (IEEJ), is dedicated to developing and regularly updating decarbonisation pathways, particularly for ASEAN countries, by reflecting ongoing regional developments. Explore our latest insights and updates on these pathways.
Read related reportResult of the analysis
Comparison with IEA scenario
ERIA/IEEJ conducted a comparative analysis of the CN2050/2060 Scenario and the Announced Pledges Scenario (APS) from the World Energy Outlook 2022 by the IEA
Both the IEA (APS) and the ERIA/IEEJ are backcast-type analyses since they assume the achievement of carbon-neutral pledges. However, the methodologies are different. ERIA/IEEJ adopts a cost minimisation approach using a linear programming model, whilst the IEA adopts a hybrid approach with an econometric model and a bottom-up technology model. The IEA’s approach has the advantage of being able to keep overall consistency since it balances global energy supply and demand, taking into account past trends. On the other hand, ERIA/IEEJ’s approach is easy to understand because it has a single clear criterion of value or cost minimisation. Since ERIA/IEEJ focuses on ASEAN, it also has the advantage of dividing ASEAN into 10 countries and having a high temporal resolution for electricity supply and demand balances.
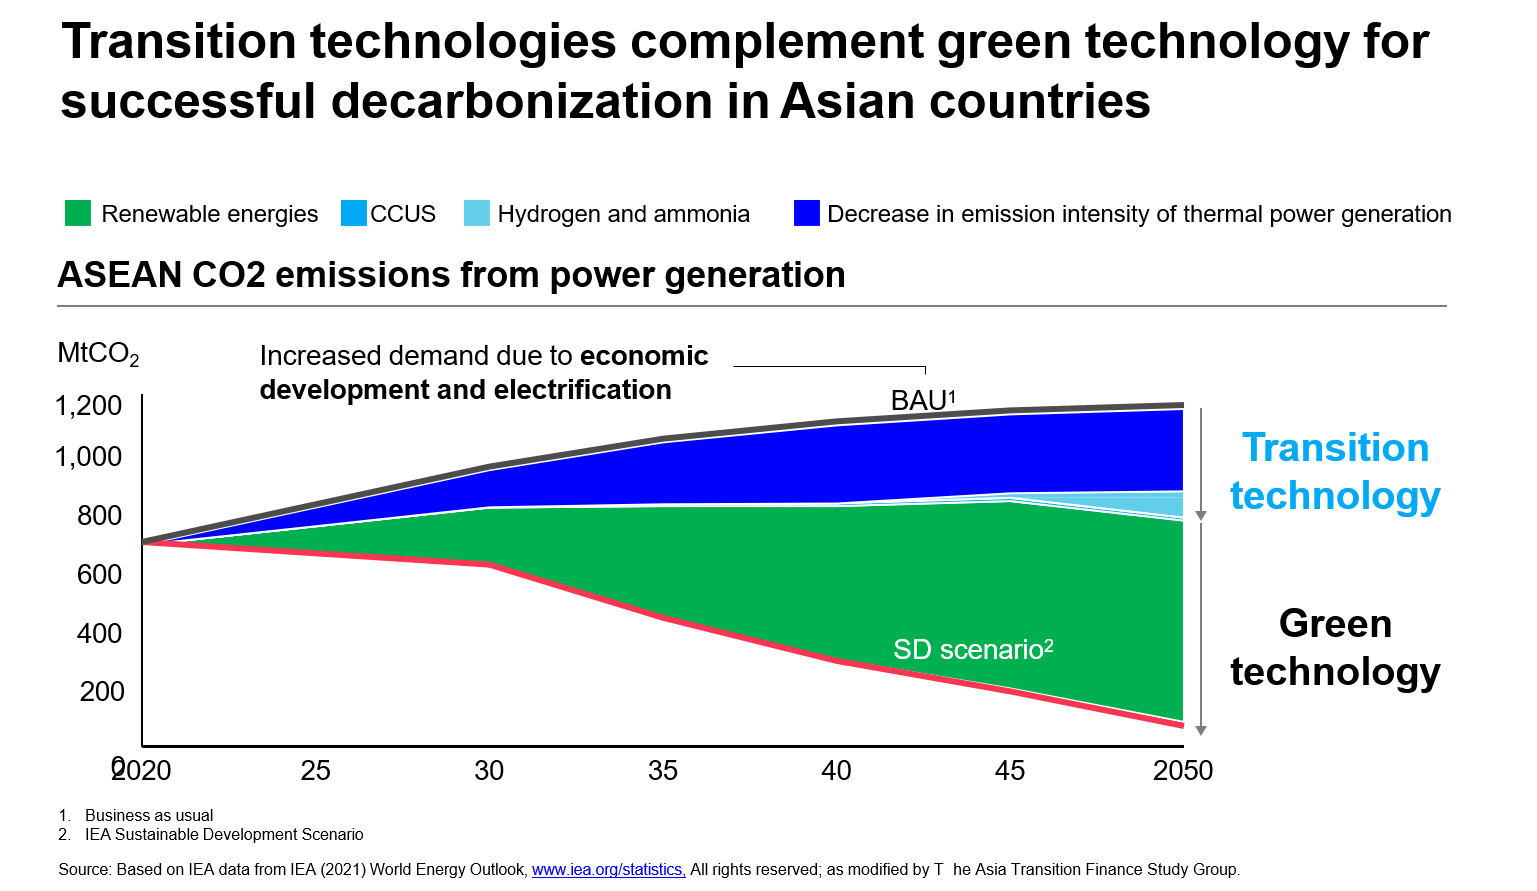
The biggest differences between the IEA (APS) and the ERIA/IEEJ scenarios come from the assumptions on future economic growth and the outlook for progress in energy efficiency. Compared to ERIA/IEEJ, the IEA expects less economic growth and more improvement in energy efficiency and draws a roadmap mainly relying on electrification and a shift to renewables in power generation. On the other hand, in order to respond to robust economic growth and the resulting energy demand, the ERIA/IEEJ scenario needs to expand the use of fossil fuels (especially gas) in the near-to-medium term, in addition to the maximum deployment of renewables beyond the IEA, as seen in the key indicator for energy mix including primary energy supply. Simultaneously, hydrogen/ammonia, fossil fuels with CCS, CDR such as DACCS and BECCS, and natural carbon sinks are introduced to decarbonise fossil fuels and achieve net zero.
Comparison of Primary Energy
Supply in ASEAN

When discussing the roadmap towards net zero, attention tends to focus on the ratio of renewables, but it is important to consider how the amount of energy demand is anticipated. The energy mix to be pursued depends on this. There is uncertainty regarding the future economic growth of developing countries. Given that it takes many years to develop an energy infrastructure, it is necessary to consider a roadmap that takes this uncertainty into consideration.
Key methodology
The analysis was conducted by using an optimum technology selection
model (the
Institute of Energy Economics, Japan [IEEJ]–
The IEEJ-NE model, which was formulated as a linear programming model, considers the cost and performance of each energy technology as input values and yields a single combination of the scale and operational patterns of the individual energy technologies to be introduced. Given various constraints such as CO2 emissions, the power supply–demand balance, the upper limit on the introducible amount of each power source, and the load curve, this model minimises the total cost of the energy system expressed as the sum of fixed costs, fuel costs, and variable costs such as the operation and maintenance (O&M) cost for technologies.
The model covers the energy conversion and end-use sectors (industry, transport, households, and commercial), and incorporates more than 350 technologies into them. It evaluates the combinations of technologies by giving factors such as capital costs, fuel costs, and CO2 emissions for each technology. The model includes low-carbon technologies, such as solar photovoltaic (PV) power generation, onshore and offshore wind power generation, hydrogen (H2)-fired power generation, ammonia (NH3)-fired power generation, negative-emission technologies such as direct air capture with carbon storage (DACCS), and bioenergy with carbon capture and storage (BECCS).
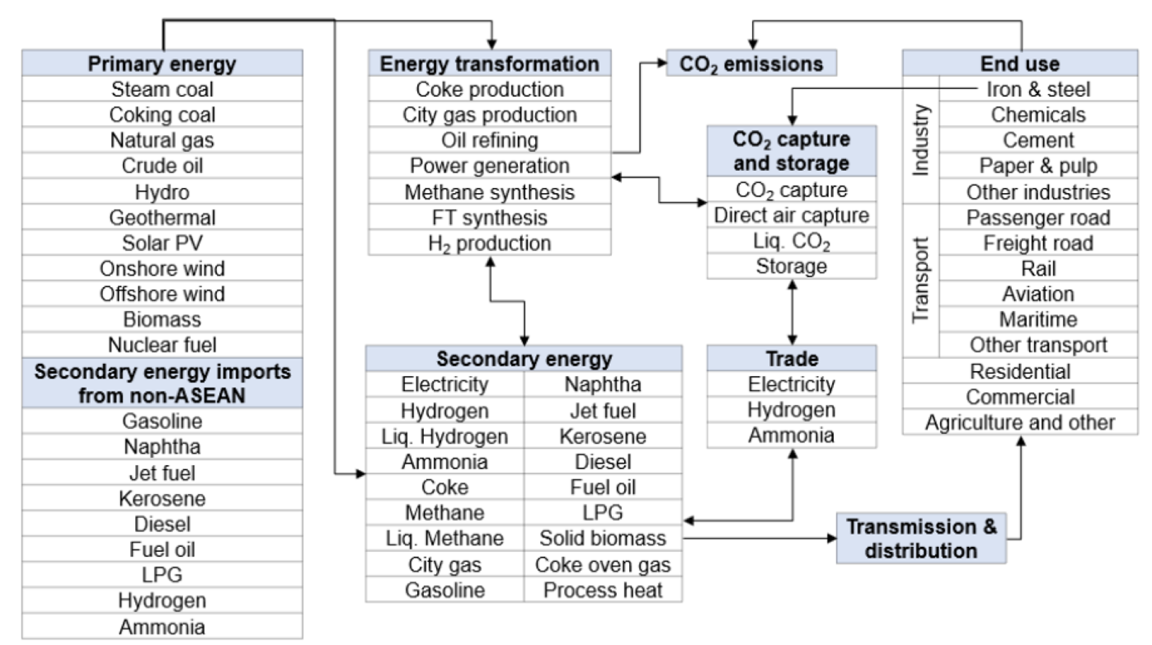
The IEEJ-NE model shows the entire energy system, starting from energy production and imports, secondary energy conversion, intraregional energy trade, CO2 capture and storage (CCS), and final consumption. The model assumes various types of energy to be consumed as shown in the diagram below. The modelling of the end-use sectors is based on data from the ERIA outlook, the IEA energy balance table, and the IEEJ outlook. However, some sectors were not simulated due to a lack of data in the public domain.
Modelled Energy System in the
IEEH-NE Model
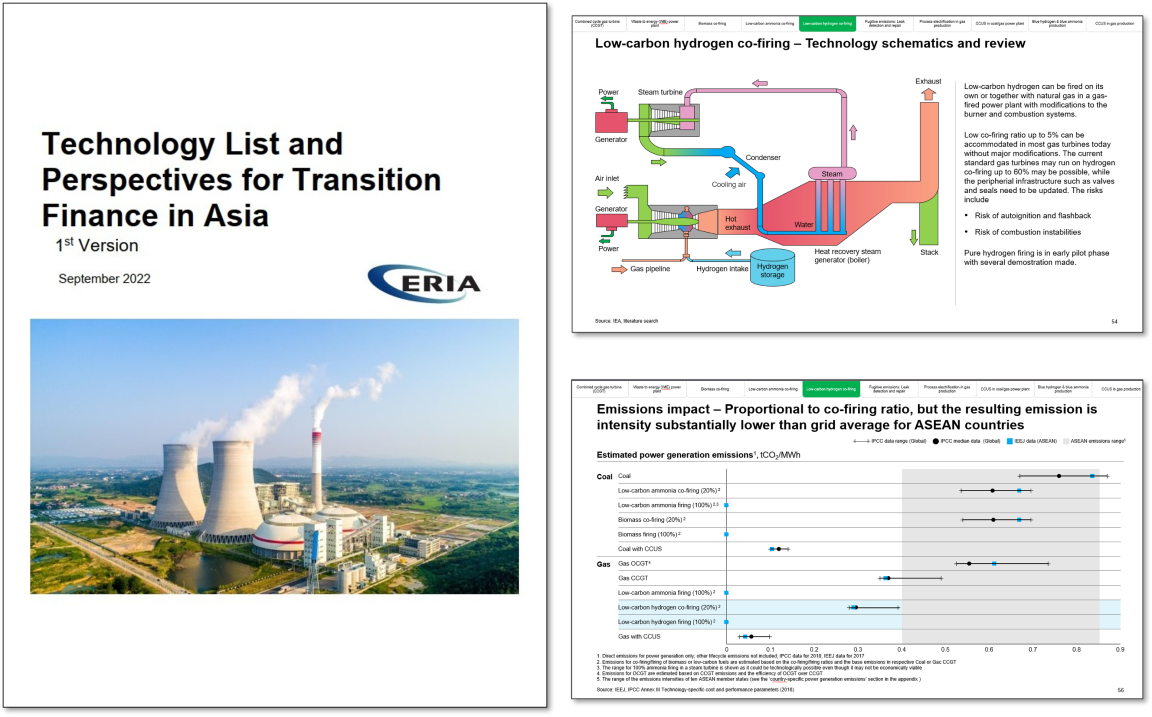
Technology List and Perspectives for Transition Finance in Asia (TLP)
Technology List and Perspectives for Transition Finance in Asia (TLP) aims to complement the decarbonisation pathways by providing a fact-based overview and a framework for assessing a potential sustainable and transition technology.
About TLP
While investments in green or zero-emission activities will contribute to the decarbonisation of Asian economies, investments in so-called transition activities—that is, those that focus on eliminating or significantly reducing emissions from existing sources or against a baseline over a set time period, will also be crucial.
However, many financial institutions in Asia still hesitant to fund transition activities due to the complexity of the evaluation of technologies. To accelerate financial efforts to decarbonize economies, they need clear standards and guidelines to ensure financial flows are consistent with a pathway towards net-zero CO2 emissions.
The Center publishes “the Technology List and Perspectives for Transition Finance in Asia (TLP)” to provide a comprehensive list of technologies that will be crucial for decarbonisation in Asia, and examine the potential transition technologies from key aspects, such as emissions impact, affordability, and reliability/maturity.
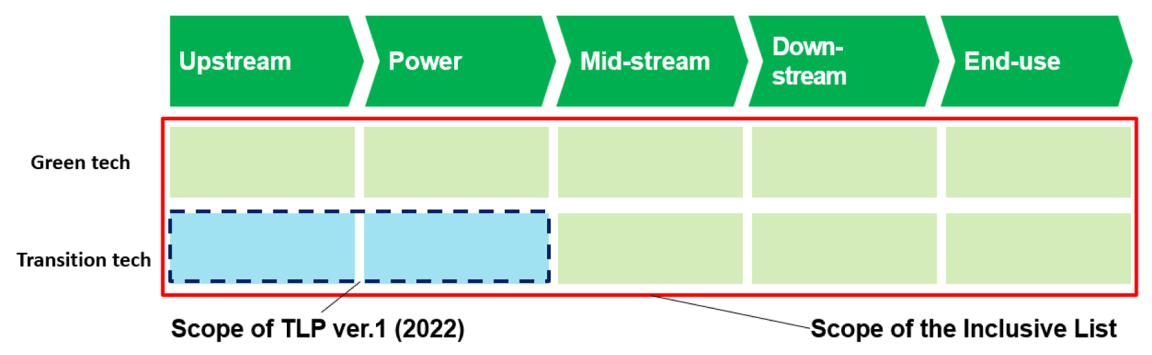
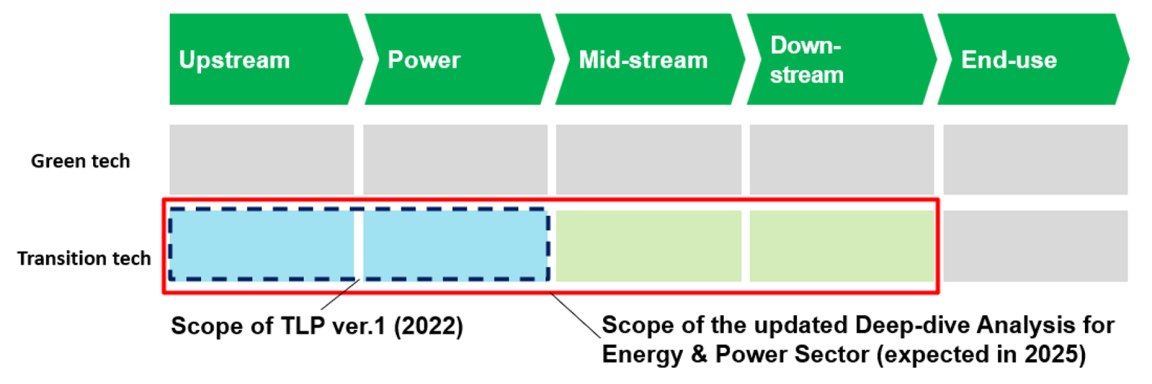
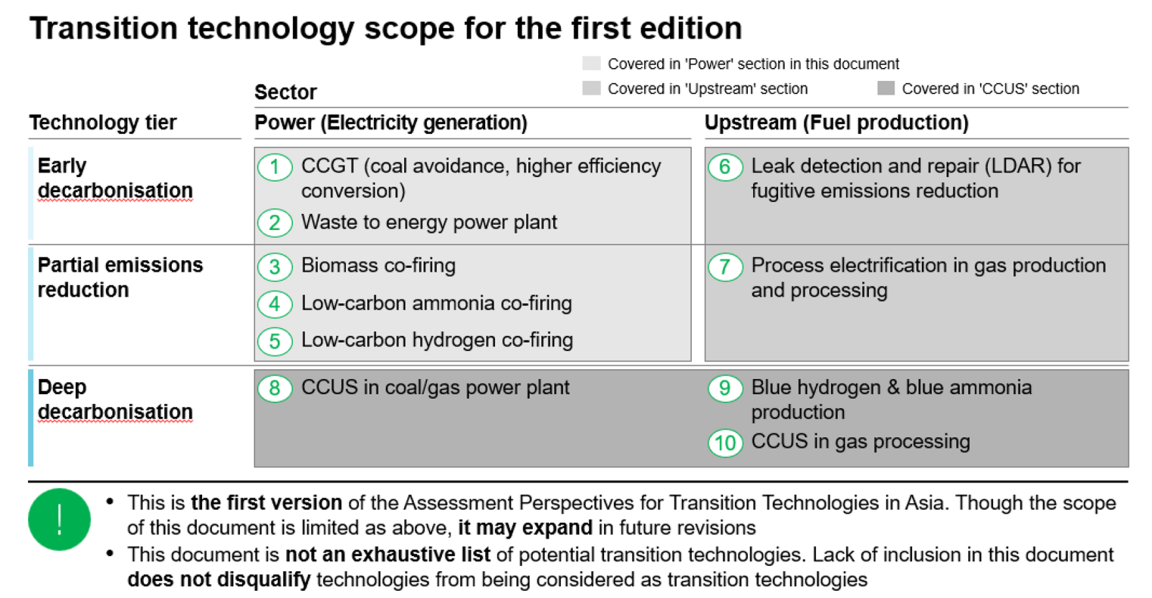
The first version published in 2022 focuses primarily on the power sector and related upstream activities that together account for more than 50% of the region’s CO2 emissions. Future versions of this report will revise and widen its scope, and lack of inclusion here does not disqualify a technology from being considered as a transition technology.
The Center will continue to update the technology list for better serve the needs of stakeholders by providing standards and guidelines of new and developing technologies in different sectors.
The Inclusive List
Since the launch of the first version of TLP in 2022, a number of requests have been received to cover a wider scope of technologies which can address both energy-related and non-energy-related emissions.
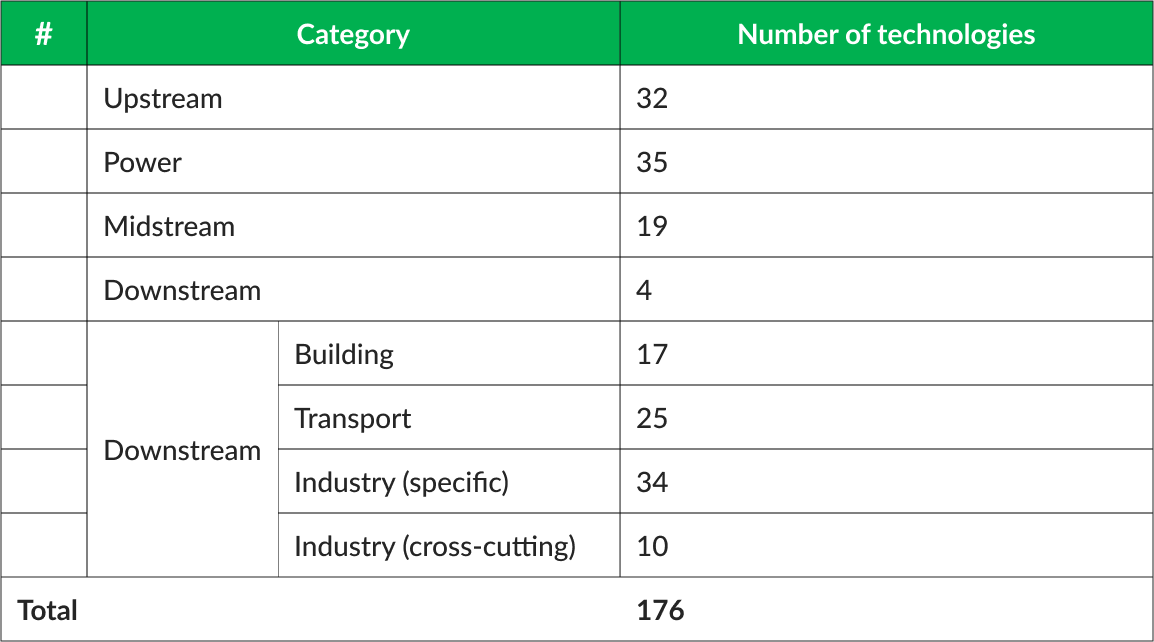
Therefore, the Center issues the “Inclusive List of Green & Transition Technologies” to cover both green and transition technologies which can address both energy-related and non-energy related emissions for all the sectors, namely upstream, power, mid-stream, down-stream, and industries sectors including the energy end-use sector.
To create the inclusive list of green and transition technologies, a three-step approach was applied. The first step was to understand the emission profile of ASEAN over different sectors to identify sectors which have more urgent needs for decarbonisation, the second step was to compile potential green and transition technologies from a wide variety of sources, and the last step was to apply a set of selection criteria to make the list focused and merge some technologies together under an umbrella technology.
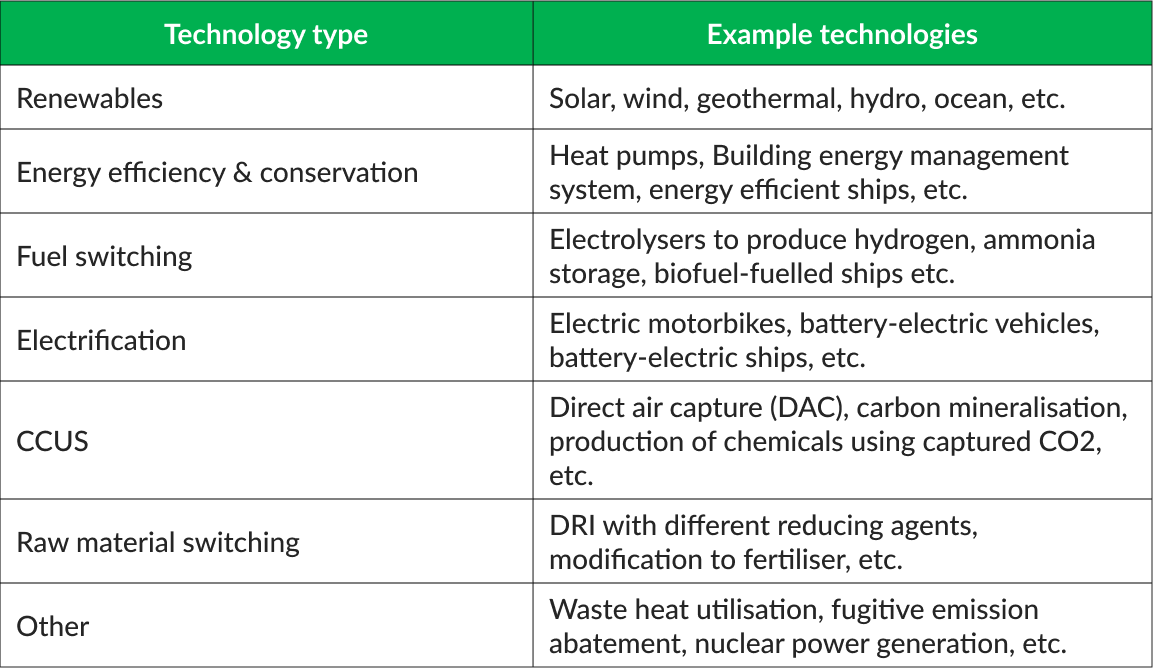
As a result, in total 176 technologies were identified as green and transition technologies. Those technologies can be classified into several technology types by decarbonisation mechanisms. Those technologies can be classified into several technology types by decarbonisation mechanisms as shown below
Number of Technologies identified for different sectors
Types of Identified Technologies
Inclusive List of Green & Transition Technologies (TLP Ver.2)
Power and Energy Sector
In ASEAN, the energy sector, including direct fuel combustion and electricity use, is the largest GHG emitting sector. In the energy sector, the generation of electricity and heat is the largest emitter, followed by direct combustion of fuels in the transport, manufacturing and construction, and buildings sectors. Fugitive emissions are related to the production of fossil fuels.
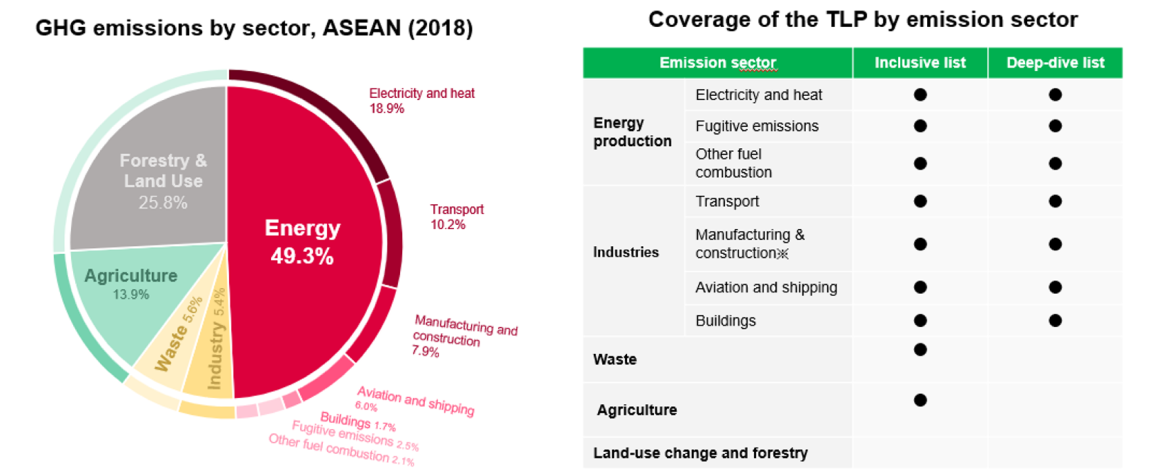
The first version of TLP focused on 10 technologies in the upstream and power sectors. As the next update of the deep-dive analysis on the power & energy sector, it will be expanded to ~20 technologies including mid-stream and down-stream sectors of the energy supply chain.
Read Full Report (TLP ver.1, 2022) Online
End-use and Industry Sector
The end-use and industries sector is where electricity and fuels are used to provide services and products. Based on the data sets of GHG emissions from direct combustion and final consumption of electricity by sector, the deep-dive analysis for the end-use & industry sector will cover ~20 technologies that belong to the following sub-sectors.
- Building sub-sector
- Transport sub-sector
- Cement sub-sector
- Iron and steel sub-sector
- Chemical sub-sector
- Cross-cutting industrial sub-sector
TLP version 2-1: Deep-dive on End-use and Industry Sectors
Latest Publications
Explore our newest publications where we delve into groundbreaking research and insights on achieving zero emissions across Asia. Stay informed with the latest articles, reports, and studies driving sustainable solutions and innovation in environmental conservation.

Study on the Introduction of Heat Pumps and Once-Through Boilers to Support GX in Asia Phase 2
Author(s) / Editor(s): 25 November, 2025
Towards Green Hydrogen Production Pathway in Indonesia
Author(s) / Editor(s): 30 October, 2025
Decarbonising Southeast Asia’s Hard-to-Abate and High-Emitting Sectors: Transition Finance, Technologies, and Policy Approaches
Author(s) / Editor(s): 14 October, 2025
Biofuel Market Potential for Regional Cooperation in ASEAN
Author(s) / Editor(s): 13 October, 2025
Technology List and Perspectives for Transition Finance in Asia
Author(s) / Editor(s): 13 October, 2025